Automated Climate Sensory Unit (ACSU)
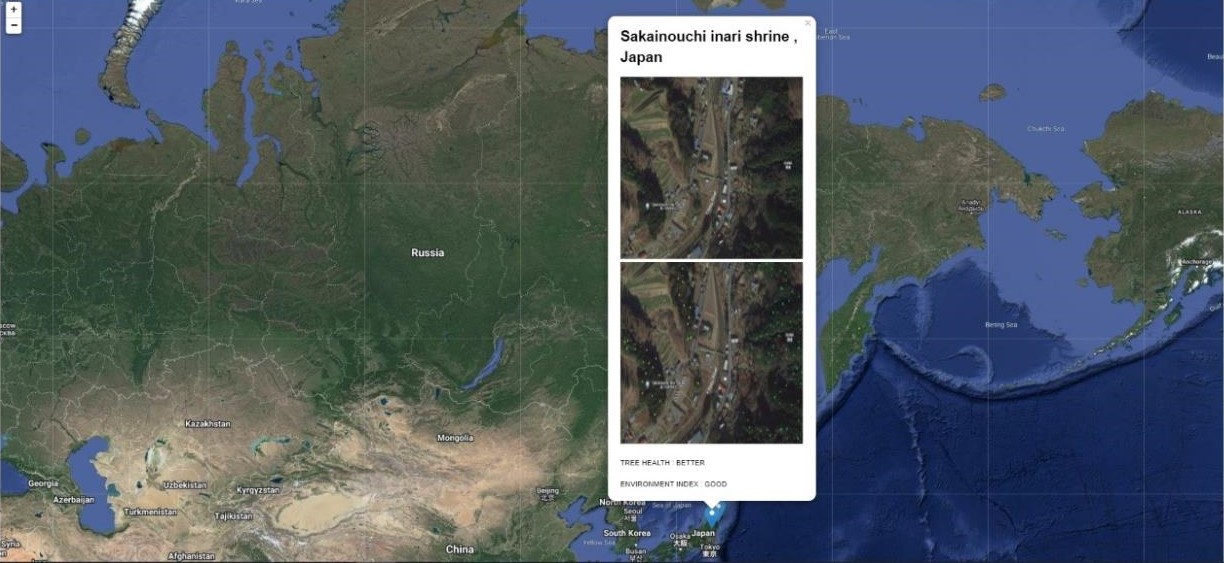
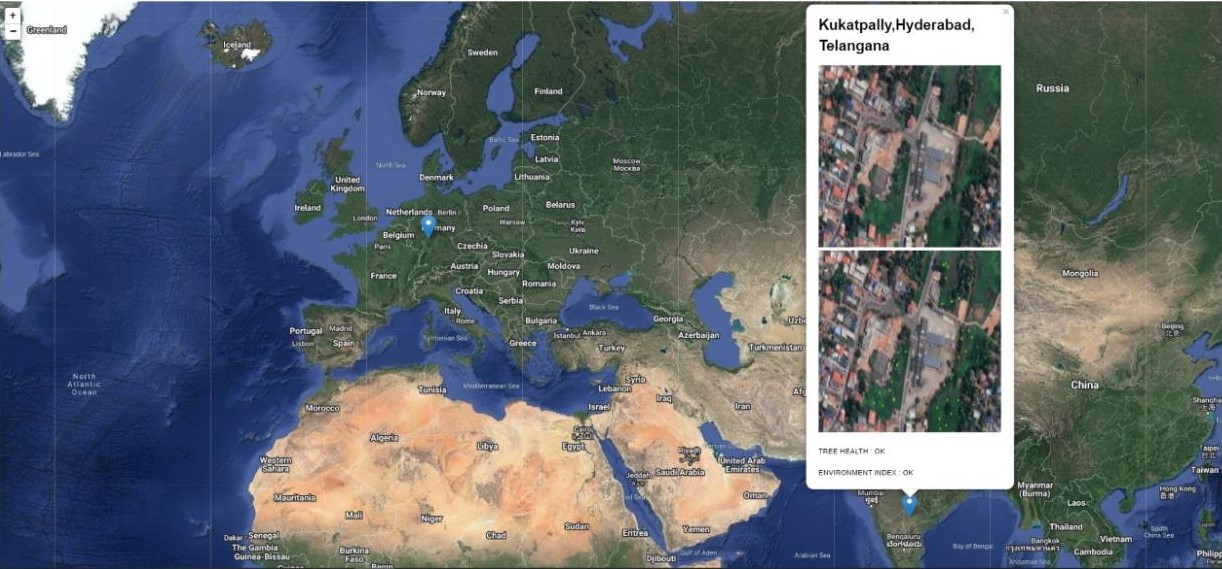
This project basically helps in determining the air quality index of the particular region we are monitoring by determining the density of trees in that particular region. The project allows the user to choose any particular location through a google earth interface and for that particular region the user will get all the data like air quality index and a layout where a map will show the density of trees in that particular area.
Introduction
Now-a-days, Due to the increasing of green house gases in our environment, there is no ecological balance in the Environment. So there are a lot of harmful and dangerous gases were getting increased and they are ringing the danger bells to all of us. Even many cities and countries are worrying about this issue and getting much affected by these harmful pollutants. This problem got raised due to the lack of less tress and got increased with Industries which releases poisonous gases every day. This results in reducing the Density of the Trees and we people should take some charges and making the environment in a cleaned manner. That's our duty. In this case, We are going to build one project that will help us to monitor and examine the Density of trees, the Air Quality Index, Etc. We will get some good results and outcomes from this project. So that we observe and maintain the density of trees in some areas.
Additional Information
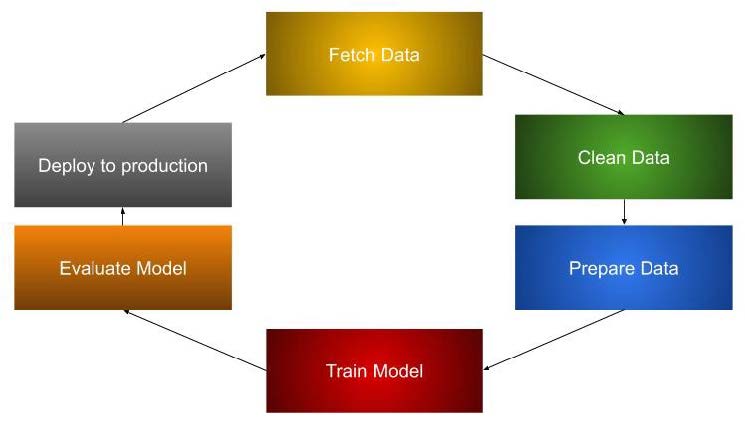
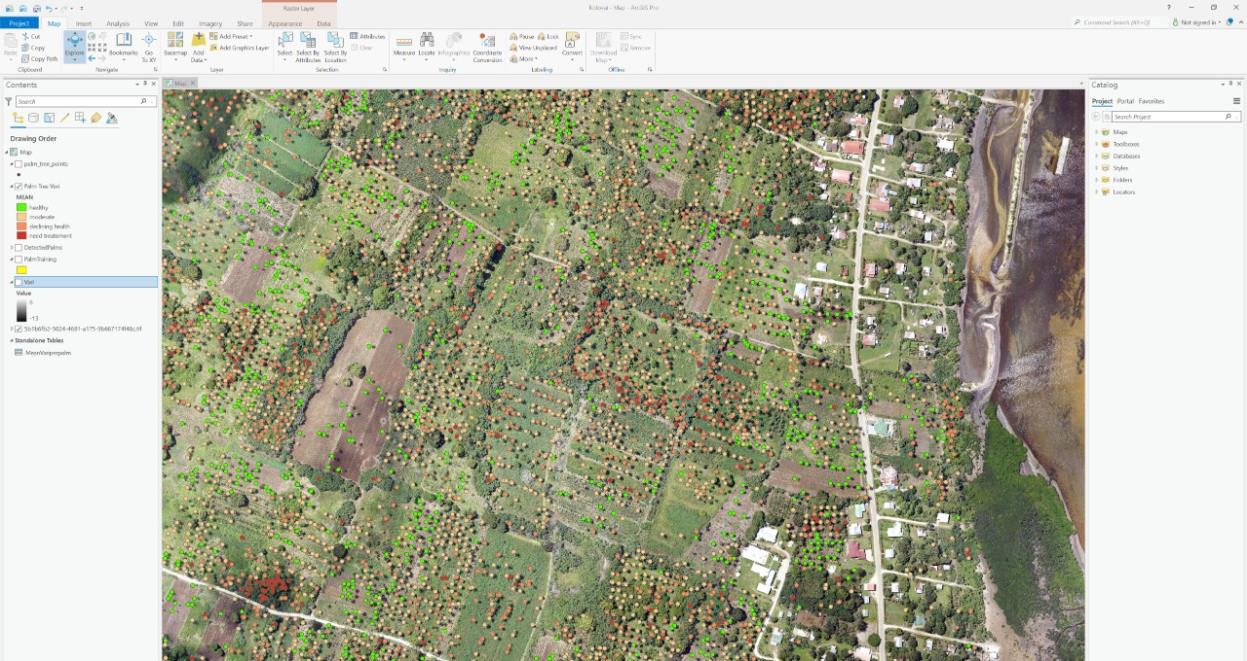
The purpose of this project is to create a model that can predict the health of individual trees and based on that we will predict the air quality index of that particular region according to the density of trees. the task is approached by using Deep Learning Model where images of trees are collected using Google Satellite Imagery and then we recall data of collected images like pixels of the trees and size of the trees. the collected images should be in High resolution which will provide absolute data features of the trees required. Once you have the imagery, you'll create training samples and convert them to a format that can be used by a deep learning model. To provide your deep learning model with the information it needs to extract in the image, we'll create features for a number of trees to teach the model what the size, shape, and spectral signature of trees may be. These training samples are created and managed through the Label Objects for Deep Learning tool. To make sure capturing a representative sample of trees in the area, we'll digitize features throughout the image. These features are read into the deep learning model in a specific format called image chips.
Module: ACSU Design and Implementation:-
(A) System Design or Architecture:
Actually, we need to simplify the process or the procedure. So for that, we are going to use the Deep Learning Model to identify the trees to make the process easier. To get this model, We need to collect and recall the images of the trees, So that it could easily collect and recall the data like Pixels of the trees and Size of the trees.
We need an absolute, accurate and even with the HIGH-Resolution Pixel Photos are required and these are more necessary and essential things for the extraction of the features.
In this method, We use a Google Satellite Imagery to collect the Images of the Forest or the Area. There are some steps involved in downloading the imagery.
As we are using the Deep Learning Model for the project, So the training of the data is more important.
The training schema is created on the basis of the classification of trees by predicting the Air Quality Index, Density, and Environmental Index.
These training samples are created and managed through the Label Objects for Deep Learning tool.
(B) Working Principle:
Many harmful pollutants mixed in air causes the surrounding air polluted and harmful for human beings. The main pollutants are carbon monoxide, lead, nitrogen oxides, ground-level ozone, particle pollution (often referred to as particulate matter), and sulfur oxides. The greater the level of air pollution and the greater the health concern.
For example, an AQI value of 50 or below represents good air quality, while an AQI value over 300 represents hazardous air quality. For each pollutant an AQI value of 100 generally corresponds to an ambient air concentration that equals the level of the short-term national ambient air quality standard for protection of public health. AQI values at or below 100 are generally thought of as satisfactory.
When AQI values are above 100, air quality is unhealthy: at first for certain sensitive groups of people, then for everyone as AQI values get higher.
At present, the days are getting worse and we are destroying the environment drastically. So, to avoid these issues and problems, We developed a project which gets monitored and gives a clear information regarding the Air Quality Index, Density of the Trees, Etc. It is more important to keep our surroundings in a clean and neat manner. That is our primary responsibility and need to maintain properly.
To decrease the increasing problem of pollution in many cities the project will help a lot where we will monitor the trees of certain area and detect its health and density of trees in that area and based on that air quality index will be monitored and the progress will be recorded which in result help decreasing the problem of pollution in many cities. Whether you plant trees around your home and property, in your community, or in our national forests, they help fight climate change. Through the natural process of photosynthesis, trees absorb CO2 and other pollutant particulates, therefore monitoring of trees becomes so important as it will help in increases density of trees in cities and hence it will be beneficial against Global Warming.
Technologies and Tools used:
TECHNOLOGIES:
- FRONTEND DEVELOPMENT.
- BACKEND DEVELOPMENT.
- DEEP LEARNING.
TOOLS:
- GOOGLE STREET VIEW IMAGES.
- CONVOLUTIONAL NEURAL NETWORKING (CNN).
- HIGH-RESOLUTION RGB IMAGES.
Outputs
